Panel looks at grade-level student data
By Marcus Clem
Where student proficiency can be simplified to color codes of green, yellow and red, the St. Joseph School District sees much more red than would be preferred.
The district conducts i-Ready diagnostic testing several times per year. These tests do not have impacts on how the state regulates each school, like the Missouri Assessment Program standardized test does, but i-Ready testing helps district leaders internally know where students stand, and they publish that data ahead of events like Tuesday’s gathering of the district’s committee on academics. The committee met at the Noyes Administration Building and was open to all for public input on the big picture.
“We have multiple data points for assessing a student’s learning,” said Assistant Superintendent Ashly McGinnis. “That could be through our i-Ready platform, but that could also be through informal assessments. It could be through observations by the teacher. I think we have to be mindful that students could demonstrate mastery of learning in multiple ways.”
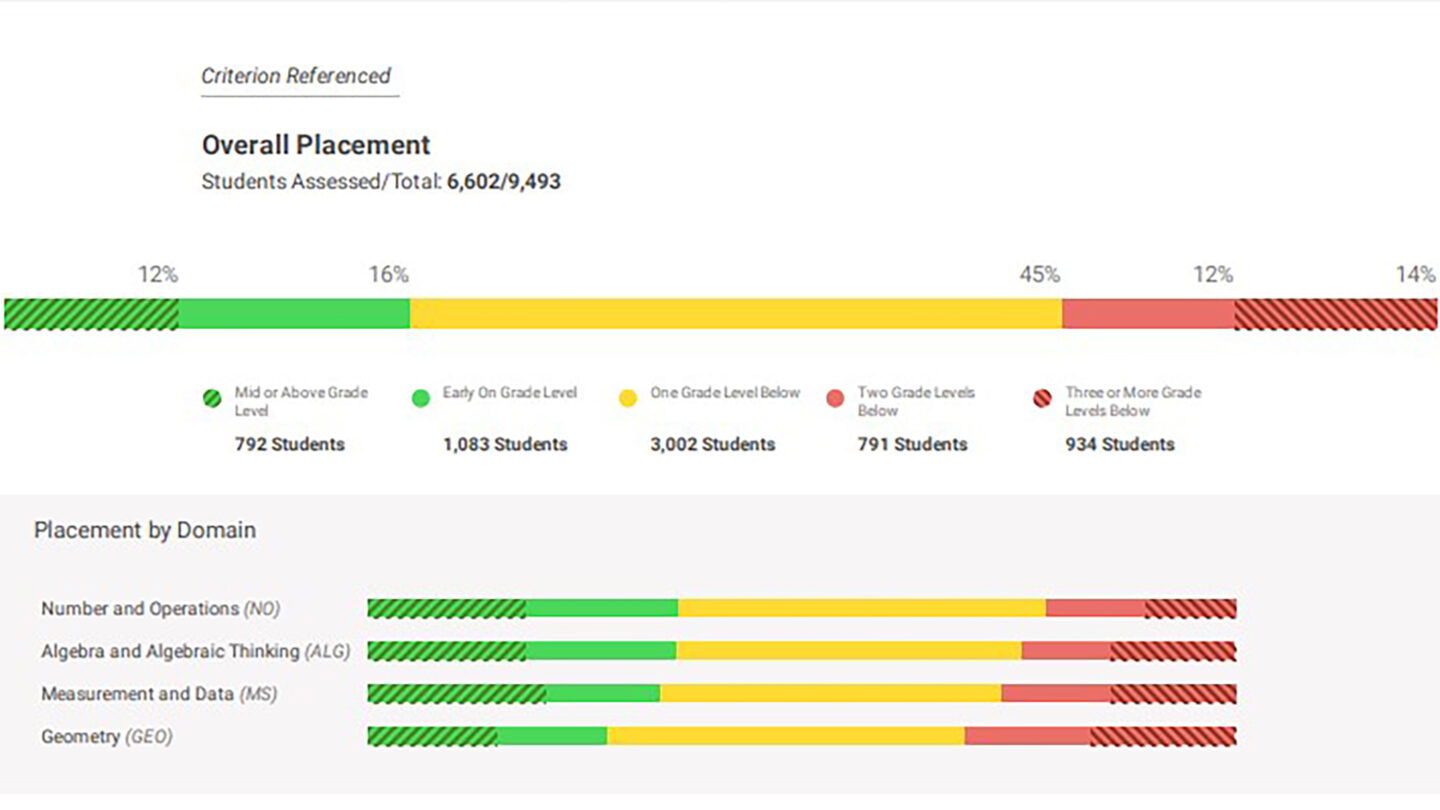
Based on data compiled Feb. 13 for grades K-8, reflecting results from a total of about 6,600 students, i-Ready data showed 28% of students are at or above grade level in mathematics. These are coded “green.” The “yellow” coded students, some 45%, are one grade level below where they are supposed to be. The “red” coded students are all at least two grade levels below standard, and add up to 26% of the total. In short, 1 in 4 of tested students at the elementary and middle school level are well below par.
The district remains below 80% satisfactory attendance — a student is in satisfactory compliance with their attendance goal when they show up for at least 9 in every 10 of their scheduled classroom hours. This is a factor, since students can’t learn reading and math skills when they are skipping school. It’s not the only one.
“We know from our kindergarten readiness assessment, just 42% of our kindergartners are ready for kindergarten,” McGinnis said. “So, many of our students are coming in already, technically, not ready for learning; they’re not at grade level.”
Reading proficiency i-Ready data is slightly better than the math data, based on the testing of just under 6,800 students in K-8 grades. Some 41% of students are at or above grade level, the “green” level. A total of 33% are “yellow,” one grade level below. Yet the “red” portion — two or more grade levels below — is higher than it is for math, at 27%. Reading establishes the ability to learn in all other subjects, so the district seeks to correct these trends as soon as possible.


